1 Introduction
In Germany, car insurance premiums heavily depend on regional classifications.
In practice, premiums are multiplied by factors subject to the residence of the
car owner. These multipliers are estimated on the basis of statistical observations
from the recent past. Few car insurers, if any, have the necessary data to estimate
multipliers all over Germany. Therefore, the German Insurance Association (GDV)
pools claims data from its members in a central database and creates regional
classifications that are available for all insurers. Although the GDV classification
divides Germany into more than 400 regions, there appear erratic transitions at
regional borders. For example, we observe unrealistic differences in the risk mul-
164 | M. C. Christiansen, C. Hirsch, V. Schmidt
tipliers of the eastern outskirts of Berlin and their neighboring regions such as
the Oder–Spree county. Practitioners intuition suggests that these neighboring
districts, which are very similar with regard to urban development and socio-
economic circumstances, should have similar multipliers. These erratic transi-
tions become less striking if classifications are refined to smaller subregions. How-
ever, reliable claims data are often not available on the subregional level.
A possible way out is to use explanatory models, which can easily yield re-
fined predictors if explanatory data are available for subregions. However, as
far as we know, there exist no explanatory models that come close enough to
the real data (nevertheless, see [7] for a more refined statistical approach to pre-
dict regional risk levels phenomenologically). In the present chapter we propose
a method that combines an explanatory approach with the phenomenological
GDV model when explanatory data but no claims data are available on the level
of subregions. The idea is to make use of an explanatory component on the sub-
regional level as far as possible and to supplement it with the GDV model on the
regional level in order to incorporate effects that can not be explained so far. Our
approach is closely related to the so-called control-variate technique which con-
stitutes a popular means of variance reduction in Monte-Carlo simulations, see
e.g. [6, 9]. Within our modeling framework we can prove that our mixed approach
is in some sense optimal.
In our application to German car insurance data presented in Section 5 we
solely focus on third party insurance, which is compulsory in Germany since 1939.
Indeed, third party insurance data are particularly well-suited for our methods,
since significant correlations between regional risks and publicly available road
data can be observed. Yet, our concept can also be applied in comprehensive car
insurance and might be helpful in other lines of business far beyond car insur-
ances.
2 The regional classification of the GDV
In the present section we provide a brief description of the current approach,
which is used in German insurance industry for the prediction of regional risk
levels. As has already been explained in Section 1, in Germany it is common prac-
tice that the premium for car insurance (third party as well as comprehensive)
depends on the county (so-called Landkreis) where the corresponding vehicle is
registered. In order to obtain a reliable data-basis the GDV collects claim data of
various insurers and associates with each county a risk level, which reflects the de-
viation of the claim sizes in the respective county from the federal average, see [5].
Prediction of regionalized car insurance risks | 165
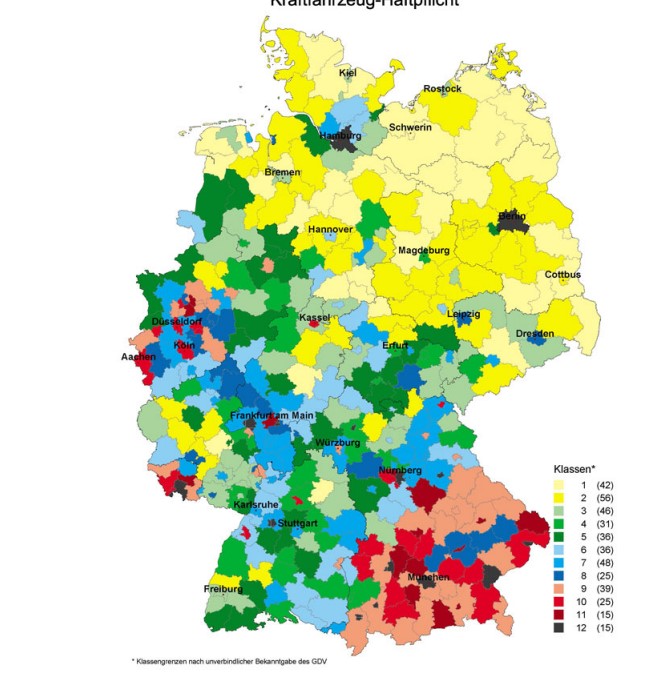
Fig. 2.1: Regional risk classes in third party car insurance (source: GDV, [5]).
A risk level of 100 corresponds precisely to the federal average, while values be-
low or above 100 correspond to more favorable or less favorable risk situations,
respectively. The precise formula which is used to determine the risk level given
the claim data is not publicly available, but it also incorporates averaging over
the most recent years. The risk levels are used to define 12 risk classes. Figure 2.1
shows a map of German counties colored according to their risk class in third party
car insurance.
3 Statistical model
3.1 Predictors of risk levels
Assume that we have a country that consists of 𝑛 regions, where the 𝑖-th region has
𝑚𝑖 subregions, for each 𝑖 = 1, . . . , 𝑛. In our application, the regions 𝑖 = 1, . . . , 𝑛 will
equal the GDV classification regions, which we refine into further subregions in
order to make the regional classification more smooth. Let Θ𝑖 and Θ𝑖𝑗 describe
fundamental risk levels of region 𝑖 and subregion 𝑖𝑗, for each 𝑖 = 1, . . . , 𝑛 and
𝑗 = 1, . . . , 𝑚𝑖. We take a Bayesian perspective here and assume that the risk levels
166 | M. C. Christiansen, C. Hirsch, V. Schmidt
are identically distributed random variables with finite second moment. For ex-
ample, think of Θ𝑖 and Θ𝑖𝑗 as claim costs per policy averaged over all policy hold-
ers in region 𝑖 and in subregion 𝑖𝑗, respectively. These values may change from one
year to another due to certain random effects. Further, for some integer 𝑑 ≥ 1 let Δ 𝑖
and Δ 𝑖𝑗 be 𝑑-dimensional explanatory covariates for region 𝑖 and subregion 𝑖𝑗. For
example, Δ 𝑖 and Δ 𝑖𝑗 could contain information on the road density. Taking these
covariates into our Bayesian framework, we assume that (Θ𝑖, Δ 𝑖), 𝑖 = 1, . . . , 𝑛 are
identically distributed random vectors. Similarly we also assume that (Θ𝑖𝑗, Δ 𝑖𝑗),
𝑖 = 1, . . . , 𝑛, 𝑗 = 1, . . . , 𝑚𝑖, are identically distributed random vectors. Suppose
that covariate data are available for each region and subregion but that claim data
are only available for the regions and not for the subregions. In our application,
each insurer has access to the GDV classification for regions 𝑖 = 1, . . . , 𝑛 but does
not have more detailed information for any subregions. That means that we can
observe the Θ𝑖, Δ 𝑖, and Δ 𝑖𝑗 but not the Θ𝑖𝑗. In insurance practice, Θ𝑖𝑗 is then typ-
ically predicted by
Θ(1)
𝑖𝑗 = Θ𝑖, (3.1)
i.e., the premium of a car insurance of an owner that is registered in subregion
𝑖𝑗 is calculated with the general risk factor for the entire mother region 𝑖. Given
the available information Θ𝑖 = 𝜃𝑖, Δ 𝑖 = 𝛿𝑖, Δ 𝑖𝑗 = 𝛿𝑖𝑗, the mean squared prediction
error is given by
𝐸(𝜃𝑖,𝛿𝑖,𝛿𝑖𝑗)[(Θ𝑖𝑗 − Θ(1)
𝑖𝑗 )2] = 𝐸[(Θ𝑖𝑗 − Θ𝑖)2|Θ𝑖 = 𝜃𝑖, Δ 𝑖 = 𝛿𝑖, Δ 𝑖𝑗 = 𝛿𝑖𝑗]. (3.2)
In this context we investigate the following question: Can we find a predic-
tor for Θ𝑖𝑗 that is better than Θ𝑖, i.e., a predictor whose mean squared prediction
error is smaller than the value given in (3.2)? An alternative to the phenomenolog-
ical model of the GDV is explanatory modeling. A natural idea is here to predict
Θ𝑖𝑗 by Θ(2)
𝑖𝑗 = 𝐸[Θ𝑖𝑗|Δ 𝑖𝑗] = 𝑓𝑖𝑗(Δ 𝑖𝑗), since among all Δ 𝑖𝑗-measurable random vari-
ables Θ with finite second moment the mean squared error 𝐸[Θ − Θ𝑖𝑗
2
| Δ 𝑖𝑗] is
minimized for Θ = Θ(2)
𝑖𝑗 .
The function 𝑓𝑖𝑗 : ℝ𝑑 → ℝ describes the effect of the explanatory covariate
Δ 𝑖𝑗 on the regional risk level Θ𝑖𝑗. Since we assumed that the (Θ𝑖, Δ 𝑖), 𝑖 = 1, . . . , 𝑛
are identically distributed and also that the (Θ𝑖𝑗, Δ 𝑖𝑗), 𝑖 = 1, . . . , 𝑛, 𝑗 = 1, . . . , 𝑚𝑖,
are identically distributed, there exist measurable functions 𝑓, 𝑓 : ℝ𝑑 → ℝ such
that
𝐸[Θ𝑖|Δ 𝑖] =𝑓(Δ 𝑖 ),
𝐸[Θ𝑖𝑗|Δ 𝑖𝑗] =𝑓(Δ 𝑖𝑗)